 Creator Code
RoyaleAPI
Creator Code
RoyaleAPI
 Support us with creator code RoyaleAPI
20 Win Challenge Stats of 2024
Advanced results and insights from the Clash Royale 2024 20 Win Challenge

We have just reviewed all the results of the 20 win challenge of 2024, and bring you a detailed summary of all the data we collected. Country stats, best players and much more!
The 20 win challenge of 2024 happened so close to the end of the year that our analysis of the results crashed into all our other scheduled content. But now, after around 3 weeks, we have all the charts and stats ready.
The 20 Win challenge of 2024 lasted 7 days, from 2024-12-19 to 2024-12-26. The challenge was originally scheduled to start on December 13th, but some bugs caused it to be delayed. Given that it would run over Christmas, Supercell decided to extend the duration, making it the longest 20 win challenge ever.
Across the whole week, there were a total of 5,491 winners. On average, only 1 in every 16,000 entries completes the 20 Win challenge; which puts the total at around 90 million entries.
Like last year, this 20 Win Challenge was unrelated to the official Clash Royale League, despite sharing the branding for this esports event.
Table of Contents
- The Best Countries
- Returning Winners
- Pros & Smurfs
- Smurfs Take Over The Weekend
- Related Posts
- Feedback
The Best Countries
Together with monthly seasons, this challenge is a great sample to see which regions are playing Clash Royale the most.
![]()
This year we have recorded significant changes for the most popular countries, which has caused many ranks to be reshuffled. The only thing that hasn’t changed is the top position, which is still held by Japan with a very wide margin.
Some of the most relevant changes we have noticed this year are:
- Japan and Mexico have shown significant share falls
- South Korea and China grew the most
Part of these changes could be attributed to changes in our methodology. In previous years, we mainly relied in our esports database to determine account locations, but that left a significant share of accounts (30%+) as undefined; this year we were able to reduce this share to below 5%.
| Rank | Country | Winners | Share | Change |
|---|---|---|---|---|
| 1 | Japan | 728 | 13.9% | -2.8% |
| 2 | United States | 427 | 8.2% | -0.1% |
| 3 | Mexico | 384 | 7.3% | -1.7% |
| 4 | South Korea | 317 | 6.1% | 2.3% |
| 5 | China | 309 | 5.9% | 3.9% |
| 6 | Germany | 282 | 5.4% | -0.1% |
| 7 | Iran | 207 | 4.0% | 0.6% |
| 8 | Brazil | 206 | 3.9% | -0.2% |
| 9 | France | 178 | 3.4% | -0.9% |
| 10 | Peru | 127 | 2.4% | -0.6% |
Other countries outside the top 10 that also saw a significant increase were Hong Kong, Egypt and Iraq.
This year we have also created this chart to show how country ranks have changed over time. We only have location data for this starting in 2020, so we can’t say what happened from 2017 to 2019.
![]()
One of the most remarkable features of this chart is the amount of winners from China. Their game servers were split in 2022, causing their participation to drop suddenly, as their accounts were only available in local servers. It seems that many of these players are now returning to these international servers by creating new accounts.
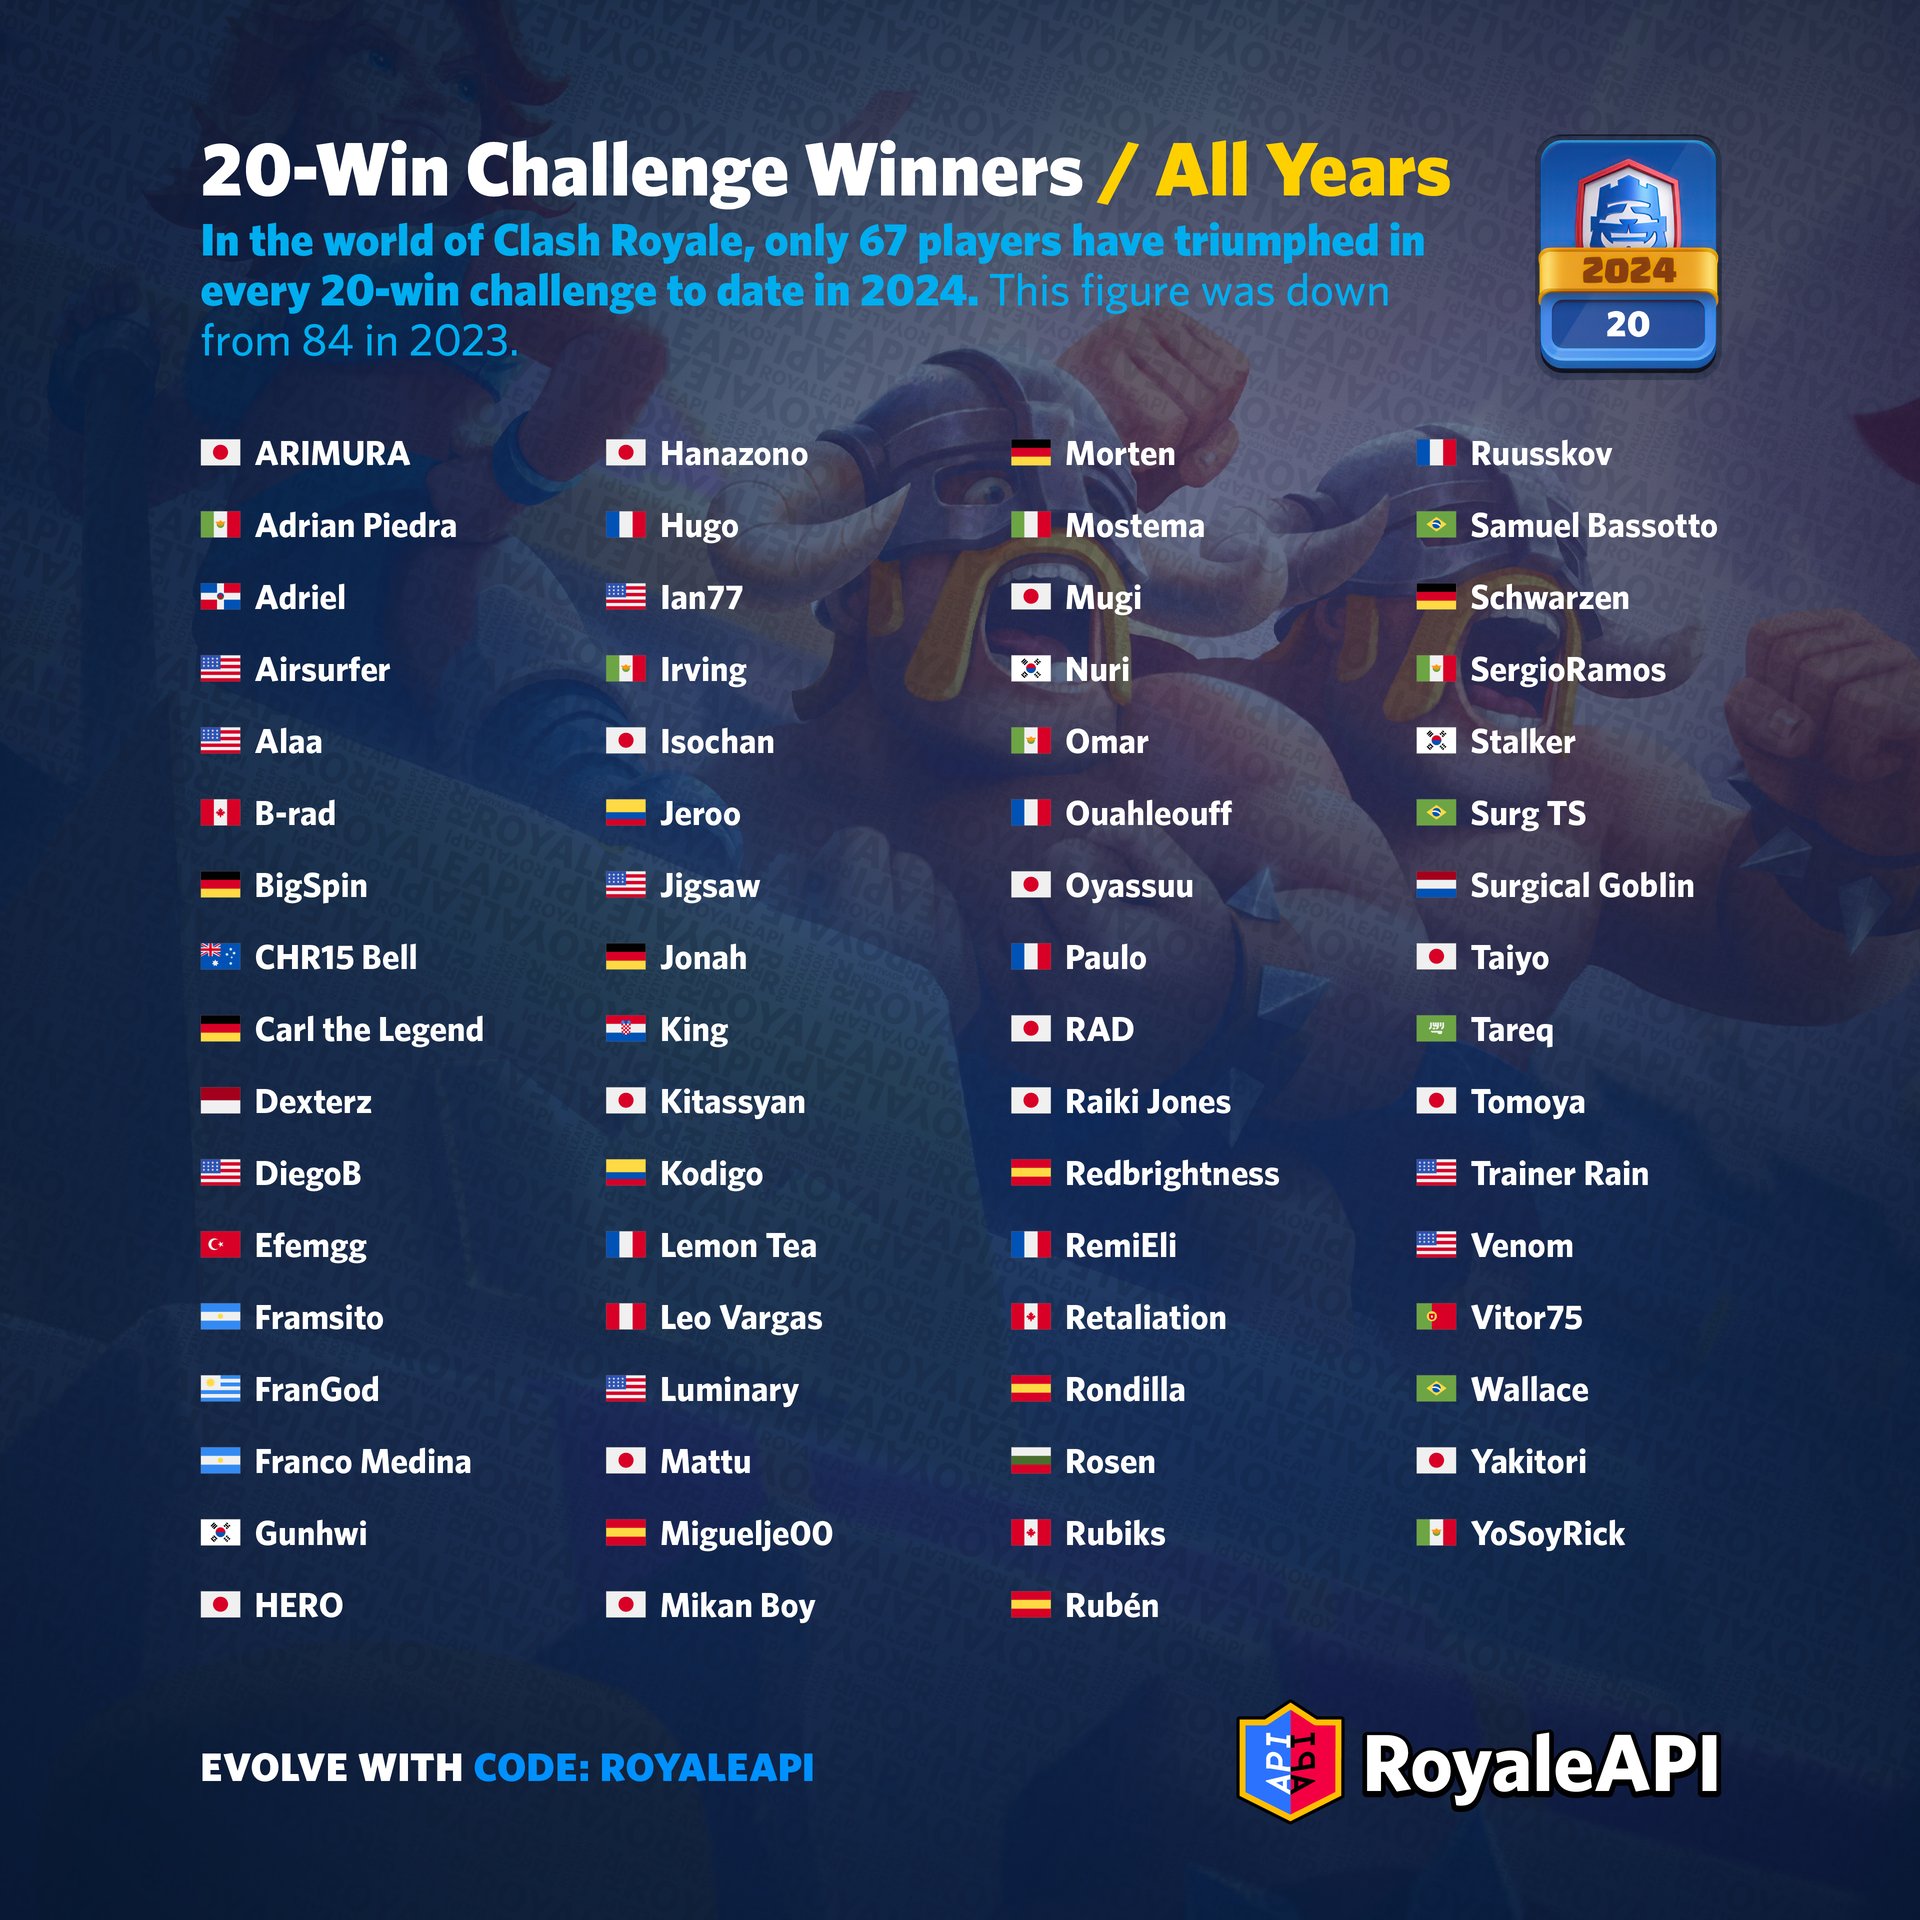
Returning Winners
The list of accounts that has consistently completed the 20 Win challenge every year keeps getting smaller. This year it has shortened from 84 to 67 players.

The countries with the most players in this list are:
| Country | Players |
|---|---|
| Japan | 14 |
| United States | 8 |
| France | 6 |
| Mexico | 5 |
| Germany | 5 |
Unfortunately we can’t currently check the results of the first 20 Win challenge, which happened in 2017 for CCGS; so our data only counts 2018 and forward.
Although being a great player makes it easier to complete the challenge on multiple years, these results show that very few players can remain consistent over such a long time. As we look at older challenges, the share of players who were already good back then shrinks to below 10%.

| Year | Winners | In Common | In Common (%) |
|---|---|---|---|
| 2024 | 5491 | 5491 | 100% |
| 2023 | 4793 | 1528 | 29% |
| 2022 | 5712 | 1118 | 20% |
| 2021 | 8360 | 896 | 11% |
| 2020 | 3445 | 329 | 10% |
| 2019 | 2500 | 267 | 11% |
| 2018 | 6723 | 369 | 5% |
| 2017 | 9989 | ??? | ?% |
This year, Terms of Service checks seem to be happening slower than usual, so 5,491 is not comparable to the amount of winners from other years. For reference, 2023 initially had 5,160 winners, but that amount was reduced to 4,793 after more than 300 permanent bans.
Another interesting stat is that the share of winners who completed the challenge last year has increased significantly.
- Of the 2023 winners, 25% had won in 2022.
- Of the 2024 winners, 29% had won in 2023.
This suggests the top-tier segment of players is becoming more stable.
Pros & Smurfs
Since new accounts without a developed card collection can compete in challenges, a lot of players are able to complete the challenge multiple times with mini accounts.
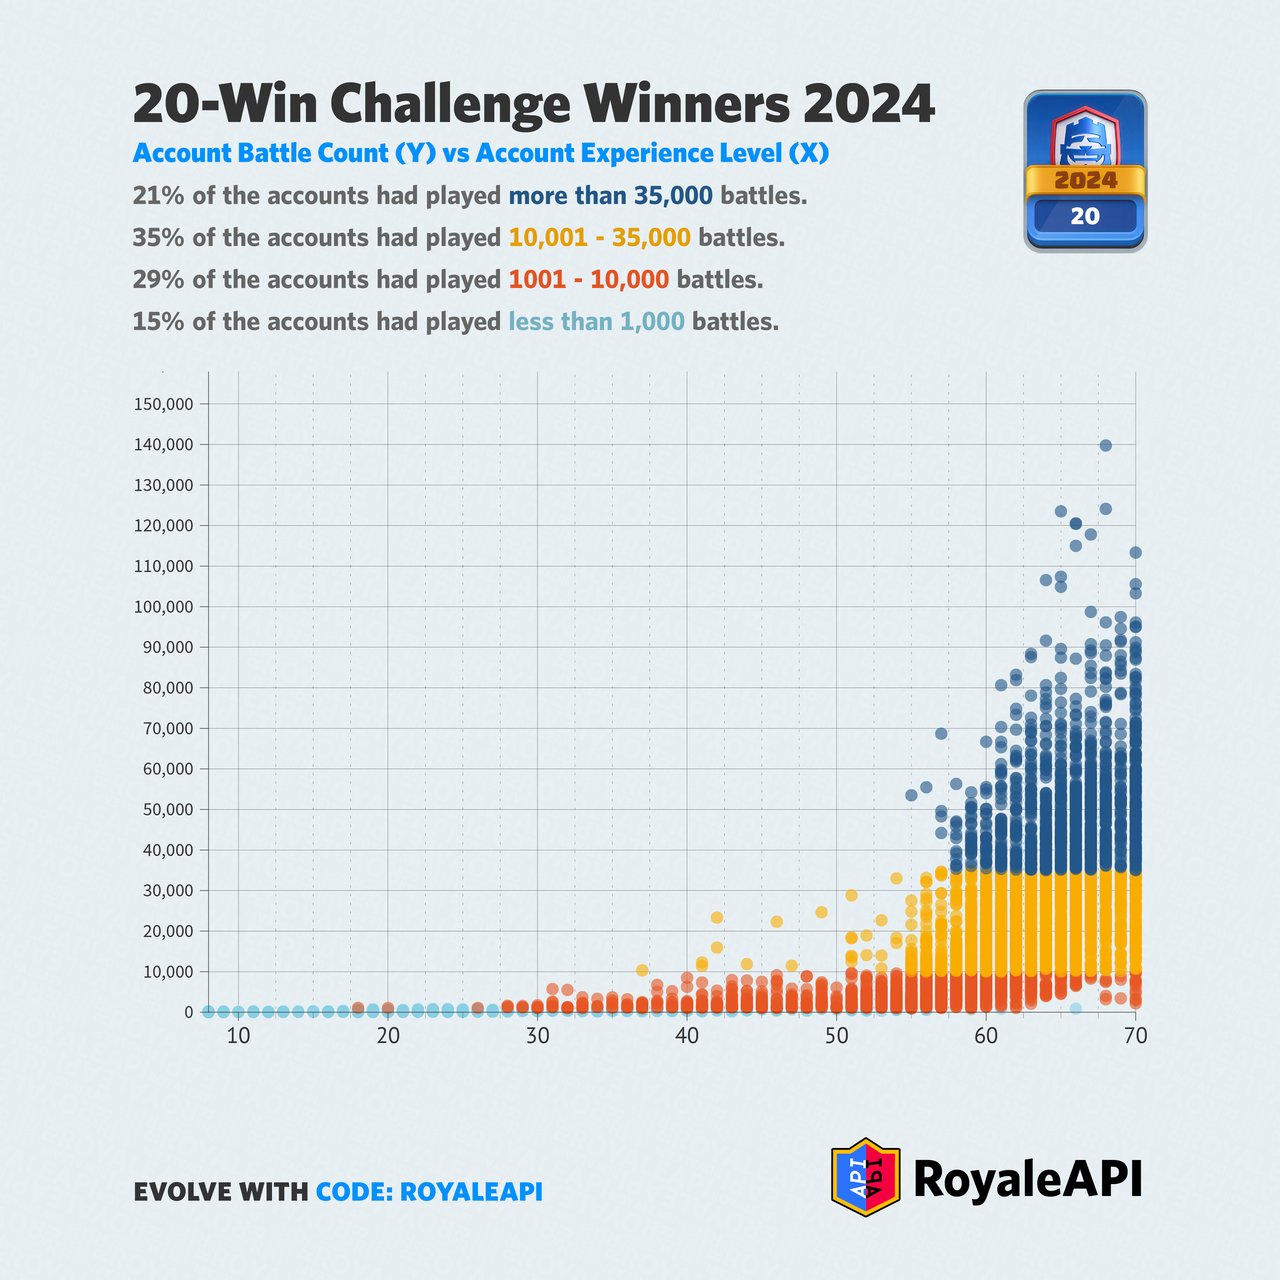
Only Supercell can know how many unique players actually completed the challenge, but we can look at basic account stats to make some estimates. A simple proxy for this is the amount of battle played.
This year we have separated players into 4 categories:
- Super Active (Dark Blue): more than 35,000 battles played, more than 12 weeks of play time.
- High (Yellow): between 10,000 and 35,000 battles played, 4-12 weeks of play time.
- Medium (Orange): between 1,000 and 10,000 battles played, from 2 days to 4 weeks of play time.
- Low (Light Blue): less than 1,000 battles played, less than 2 days of play time.
As a general rule, accounts with low and medium activity are not main accounts. Some may be players who played before and have started again from scratch, but most are simply mini accounts.
This log scale chart helps us see in more detail the cluster of accounts with less than 10,000 battles:
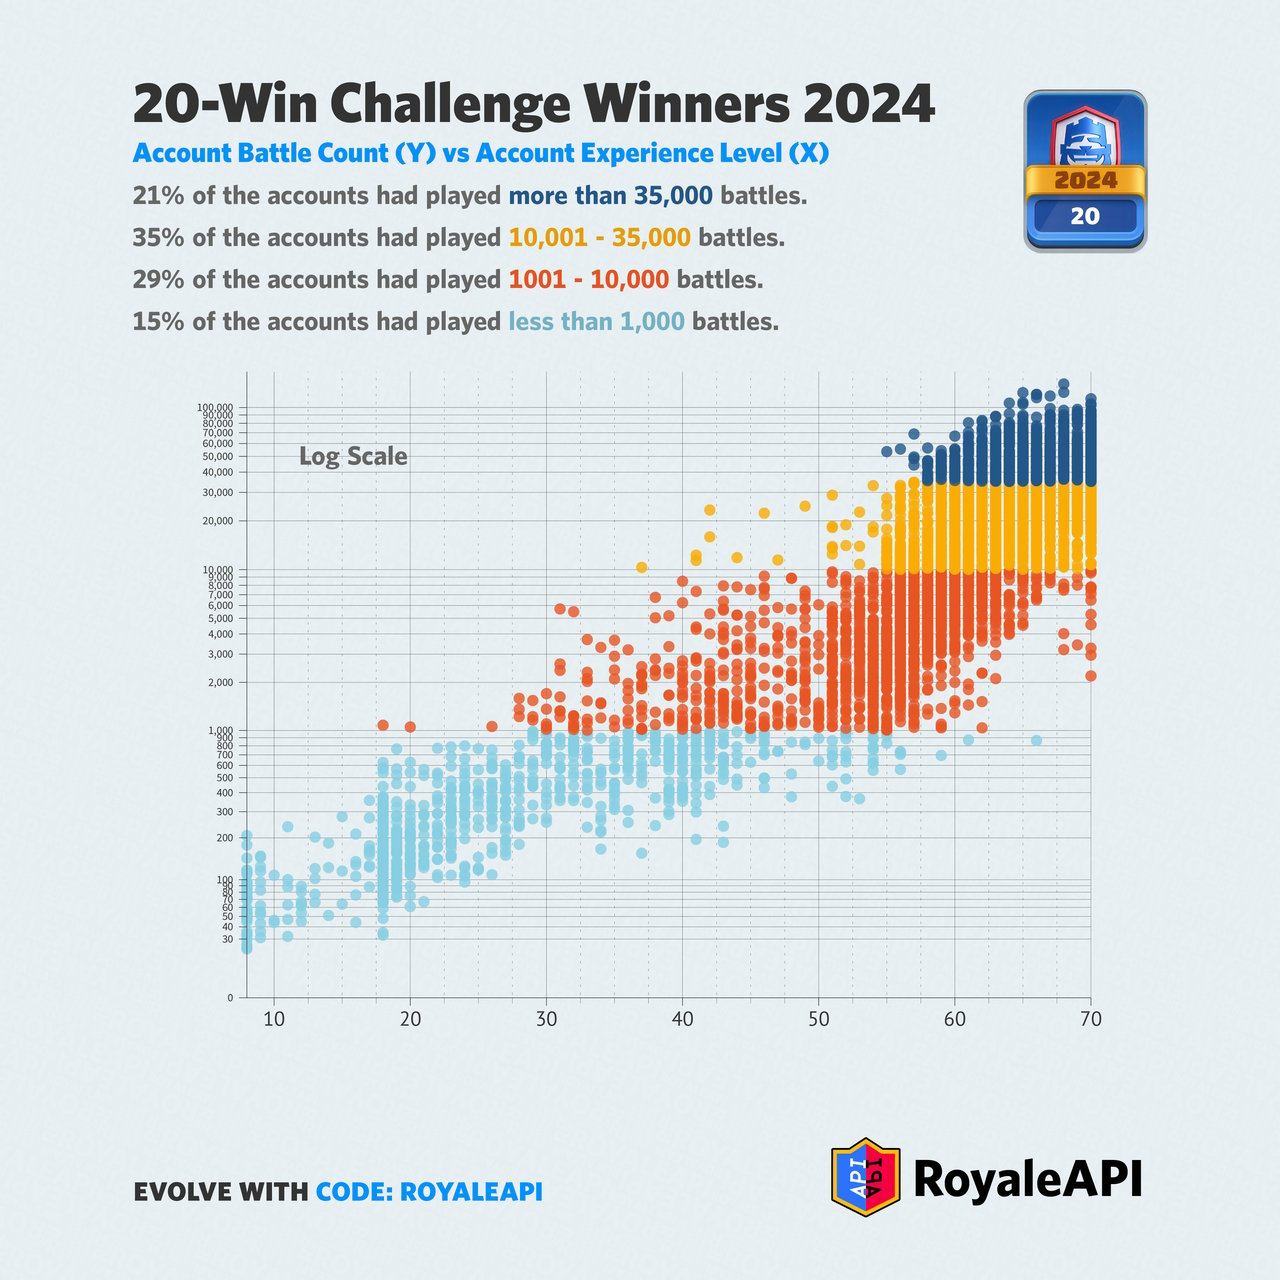
Account Level is the metric chosen for the horizontal axis because it also has a positive correlation with account activity. With these two stats combined you obtain a very useful visualisation of account activity:
- Up + right: the player has invested a lot of time and effort into the account.
- Left + down: the account is very new, likely one of the minis/smurfs that we mentioned earlier.
The total share of accounts with less than 10,000 battles is at around 44%. Based on this, we can be quite confident to say that the amount of unique winners is less than half of the total amount of winning accounts.
Smurfs Take Over The Weekend
This pattern is one we noticed last year already, and this year it remains very clear: the share of mini-winners increases through the duration of the challenge.
The most likely explanation for this phenomenon is fairly simple: players complete the challenge first with their main account, and later keep playing with minis.
Seeing a timeline of winners separated into our previous categories show how each behaves differently. The 2 middle groups keep a fairly consistent share every day. In contrast, Super Active accounts clearly decrease over time.
![Winners: Battles Played VS Days] - Clash Royale 20 Win Challenge Stats of 2024](https://cdns3.royaleapi.com/cdn-cgi/image/w=1280,h=1280,format=auto/static/img/blog/2024-20win-challenge/v1-0da2fbf4/ch20win-2024-charts-05-4-account-level-split-72.jpg)
The challenge started on a Thursday, which shows that the increased activity of Days 2 & 3 match with the weekend. This is a regular activity pattern that Clash Royale experiences regularly, so not unique to this challenge.
This is a stacked chart of group shares, which shows even more clearly the changes over time.
![Winners: Battles Played VS Days] - Clash Royale 20 Win Challenge Stats of 2024](https://cdns3.royaleapi.com/cdn-cgi/image/w=1280,h=1280,format=auto/static/img/blog/2024-20win-challenge/v1-0da2fbf4/ch20win-2024-charts-05-3-account-level-stacked-72.jpg)
It’s worth noting that the battle count boundaries for each of the groups have been intentionally picked to match this behaviour; in other words, only accounts with less than 1,000 battles played are used more over time. After that, the share remains even throughout the week.
Related Posts
Feedback
Were you surprised by any of the stats we shared? Is there anything else that you’d like to know about the challenge results? Let us know below.
If you enjoyed this article and all our other content, don’t forget to use our code: RoyaleAPI to support us!
You can also get bonus rewards at the Supercell Store. Using our code RoyaleAPI before you check out at the Supercell Store will help us greatly keep our servers running, and to keep providing quality content in the future.

Discuss
Related Posts


 Donate to support us
Social