 Creator Code
RoyaleAPI
Creator Code
RoyaleAPI
 Support us with creator code RoyaleAPI
Player King Levels and Best Trophies
How players are distributed with respect to king levels and trophies.
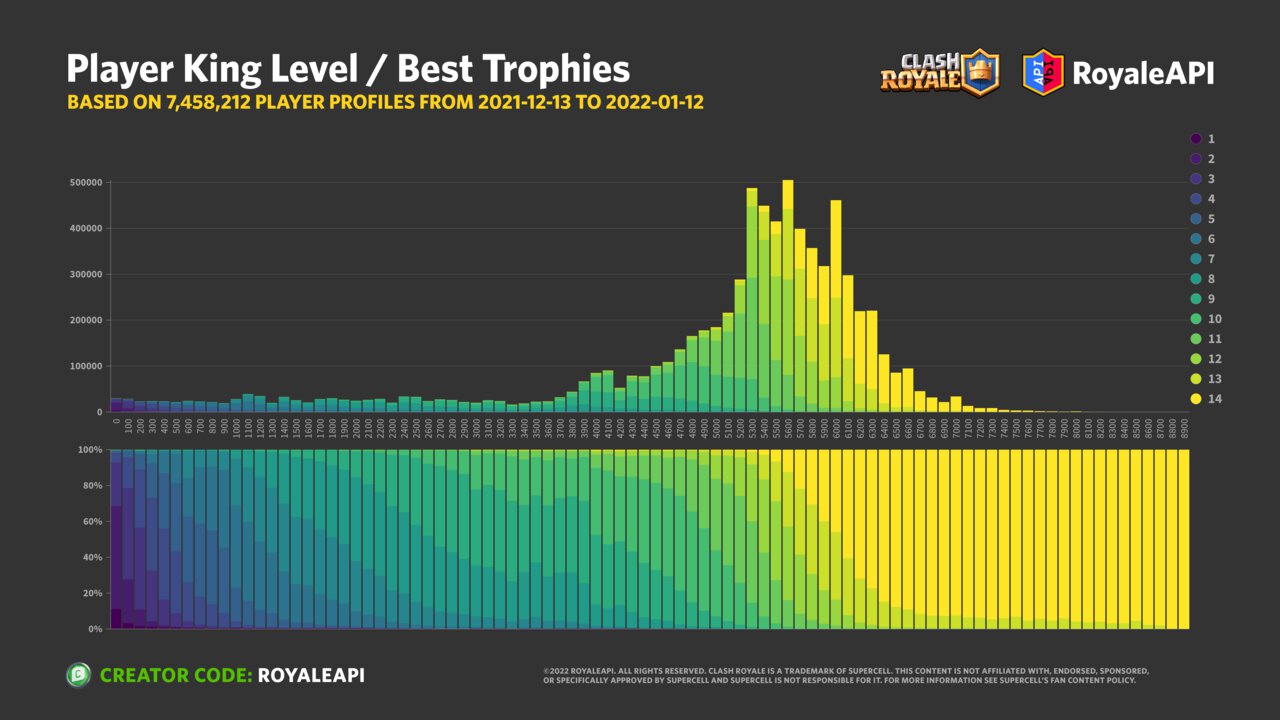
Table of Contents
- Observations
- Top Chart: Histogram by count
- Bottom Chart: Histogram by percentage count
- Trophy cluster
- Peaks Anomaly
- Lower trophy range samples
- Upper King Level Distribution
- Lower King Level Distribution
- Methodology
- Passive Data Collection
- Active Data Collection
- Player Accounts
- Data for Nerds
- Endnote
How are players distributed with respect to their king levels and best trophies? 🤔
We plotted the number of player accounts with respect to their best trophies, and segmented each column by king levels. The data is based on player profiles collected in the last 30 days (2021-12-13 to 2022-01-12).
This covers about 7.5 million player profiles in total. The sample size should be very representative of how accounts are distributed. It is however important to note that this is not the same as the entire active player base (aka Supercell absolute data). For details, see Methodology.
Observations
- X-axis: trophies
- Y-axis: player count
- Color: king level
Top Chart: Histogram by count
The top chart is a histogram of all the players, with Y representing the number of player in a trophy range, and X representing trophy ranges in 100-trophy intervals.
The trophy axis labels represent the minimum end of the range. Each bar is a range covering 100 trophies. For example, the bar for 5000 covers players with best trophies from 5000 to 5099.
Bottom Chart: Histogram by percentage count
The bottom chart represents the same information, but with each trophy range scaled to 100%. The purpose of this chart is to show the relative percentage distrbution of king levels within each trophy range.
We will take a look some interesting observations in detail.
Trophy cluster
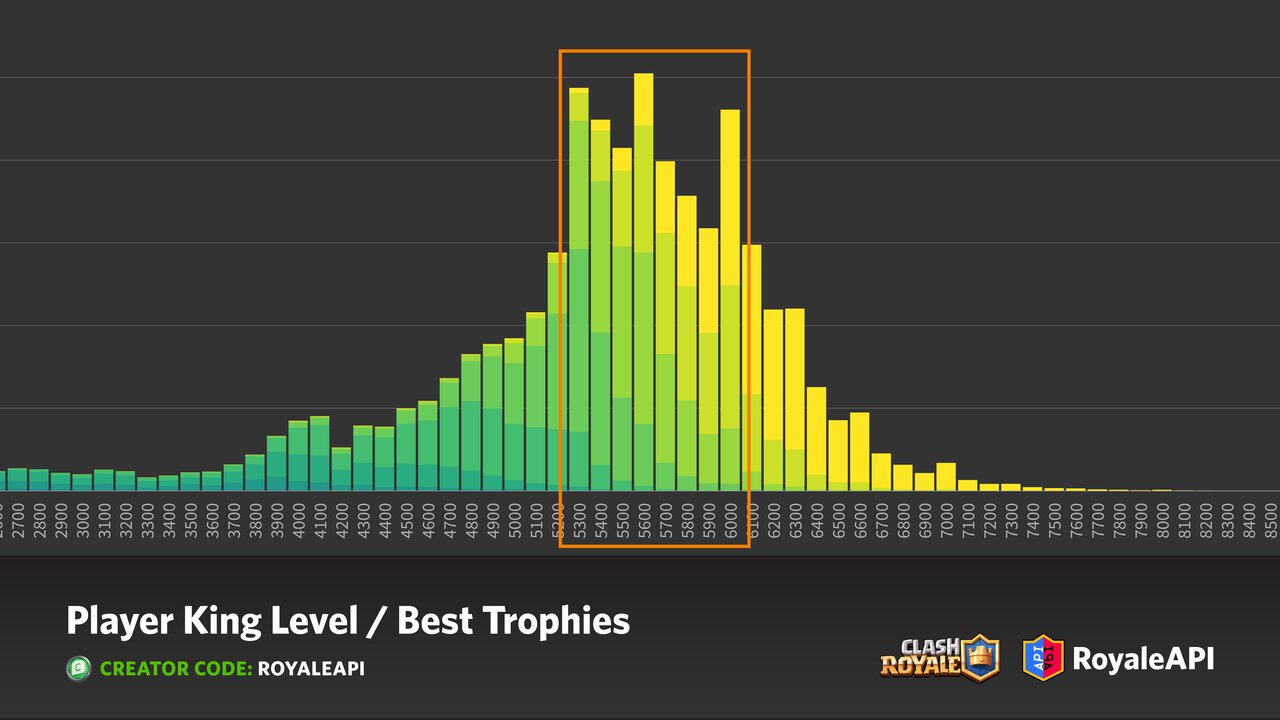
The histogram is closed to normal distribution, also known as a Bell Curve. Trophy range from 5300 to 6000 has the highest density of players. The average of all players sampled is 5029.
If we separate all the players by their king levels, then the average best trophies are:
- KL 14: 6173
- KL 13: 5816
- KL 12: 5521
- KL 11: 5201
- KL 10: 4686
- KL 9: 3871
- KL 8: 2829
- KL 7: 1830
- KL 6: 1246
- KL 5: 788
- KL 4: 470
- KL 3: 221
- KL 2: 147
- KL 1: 2070
The average best trophies for King Level 1 may seem odd for people who don’t play Clash Royale. But it is because the numbers are skewed by the fact of the number of “Level One” players in the game. Level One Players are players who intentionally keep their accounts at Level 1 to see how far they can reach. At the time of writing, the highest trophies for Level 1 is 6274, held by BluePrint=).
Peaks Anomaly
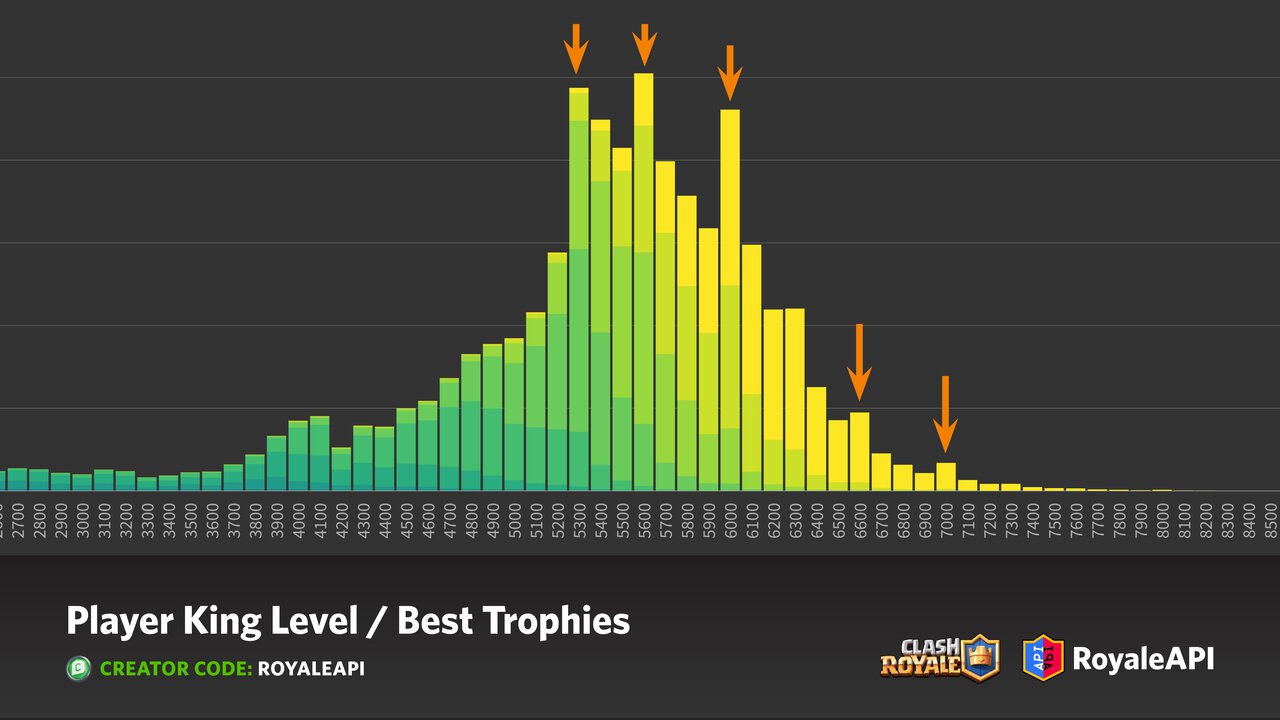
The peaks at 5300, 5600, 6000, 6600 and 7000 may look like anomalies at first if you don’t play Clash Royale. But since you do, you’ll note that they correspond to the league divisions — the trophy which separate the different leagues.
Since each bar in the histogram is bound at its minimum, and each Clash Royale Ladder battle typically gives about +/-30 trophies, they signify that many players stop pushing further once they have reached a specific league.
This behavior is consistent with how many players behave. Towards the end of each season when it is easiest to climb to one’s highest trophies, many players do stop playing Ladder so that they can finish with a shiny new league badge on their profile.
You can in fact see these very clearly on our visualization between trophies and rank, where the slope of the chart jumps and breaks at those league divisions.
Lower trophy range samples
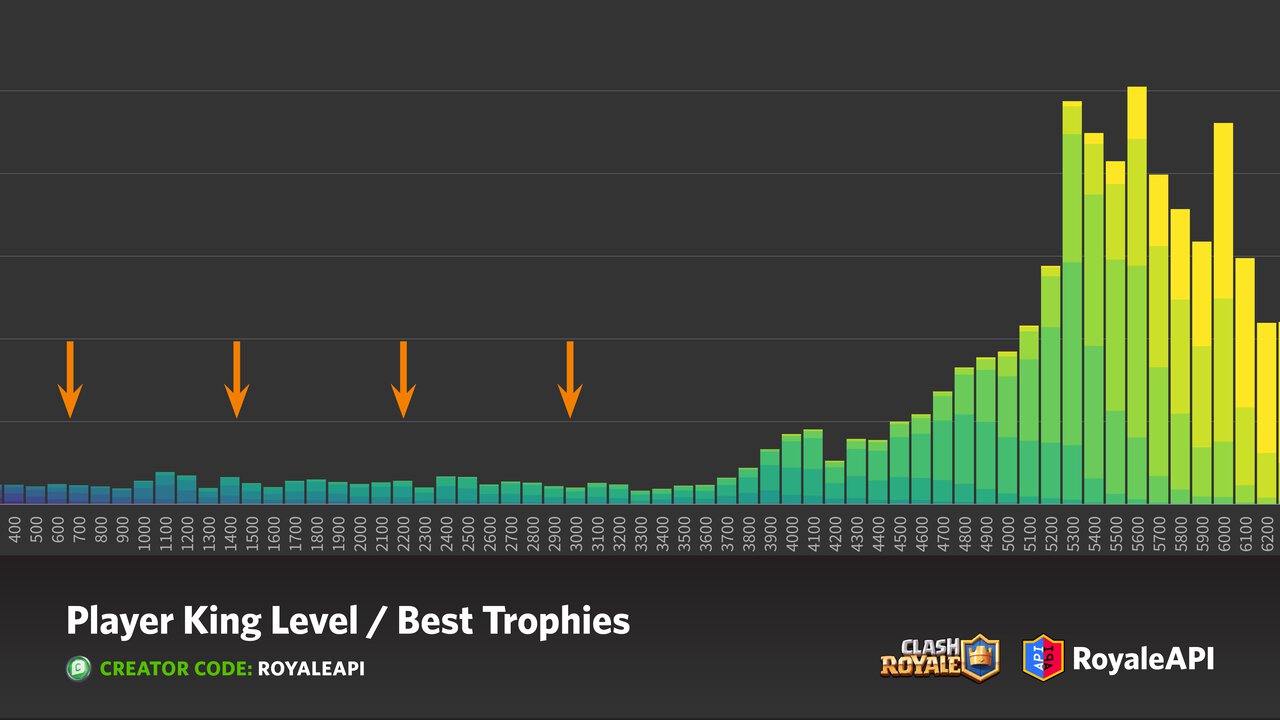
At the low end of the trophy ranges (0-3000), there isn’t a lot of players. There are two main reasons for this.
For one, it is relatively easy to push accounts to 4000 these days. The last time I have started a new account, I was able to do that in 1-2 days. That experience is a lot different than when I first started playing the game in 2016.
The second reason is that our data was collected passively (see Methodology). It‘s uncommon for new players to visit a stats and strategy third-party site such as ours to try to improve their game. As such, I’m not surprised by the possible lack of data at the lower end of the spectrum.
What I can say with confidence is that the upper end of trophy distribution is accurate and should cover most of the players. Our site is used by the best players in the world, and their frequent visits ensure that the passive data collection is always fresh.
So it’s entirely possible that there are more players at the low end, but unless we perform a brute-force player account analysis, we will never know.
Upper King Level Distribution
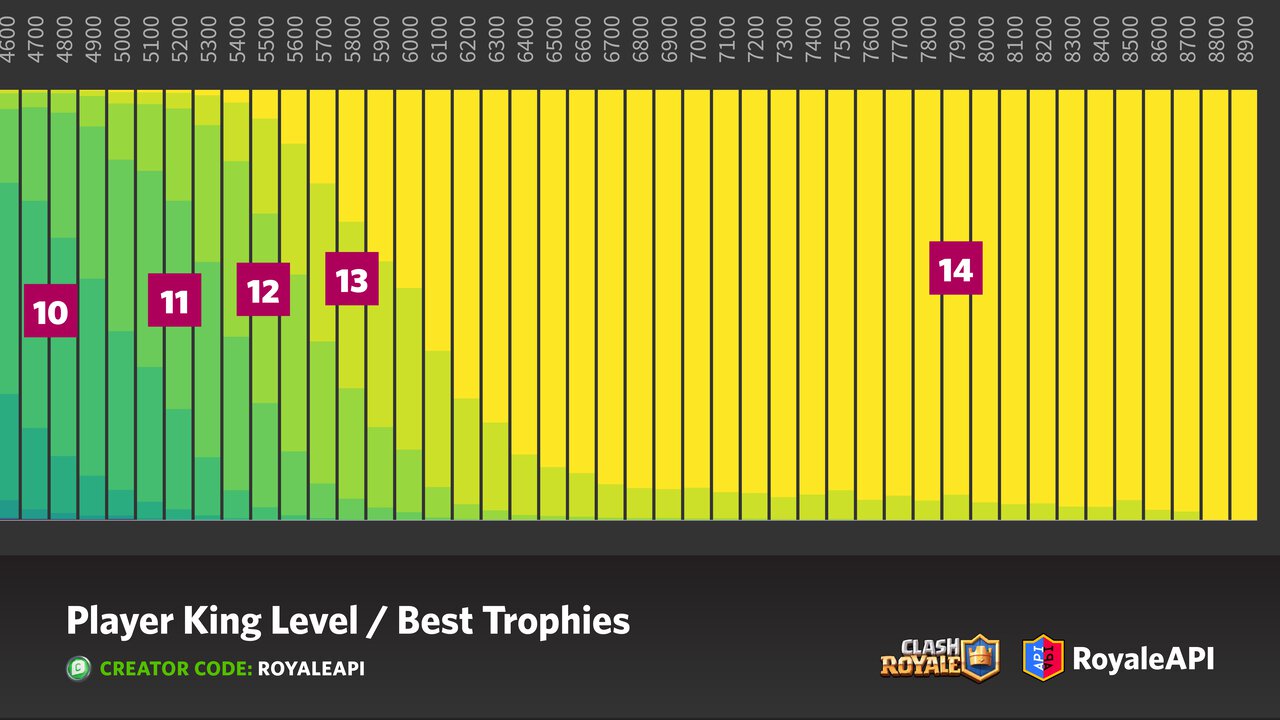
Players with the most experience naturally have the highest trophies. This should come as no surprise here. What is interesting is how wide the trophy range is. You can find KL14s with PB (personal best) as low as 5000, and as high as 8900-8999.
At the time of writing, the record is held by Mohamed Light at 8946. He set that record in August 2021.
In fact, you can find KL14s with PB at 0 also. But those anomalies are intentional. We’ve known a small number of players who intentionally keep their trophies at 0 and play grand challenges only. Some of them do this to keep away from the spotlight. Many are smurf accounts of pro players. Yet even some more believe that 0-trophy would help with their matchmaking in challenges (it doesn’t).
Similarly, KL13 and below have wide trophy ranges, but it’s not difficult to see that there are caps. If you’re a KL12 and feel bad because you aren’t able to get to 6300, don’t feel defeated. Only King Levels are represented here. The upper end of the record are often set by players who kept their king level intentionally low while having maxed (Level 14) cards. It’s safe to say that none of them were playing with Level 12 cards when they got to their personal best.
Lower King Level Distribution
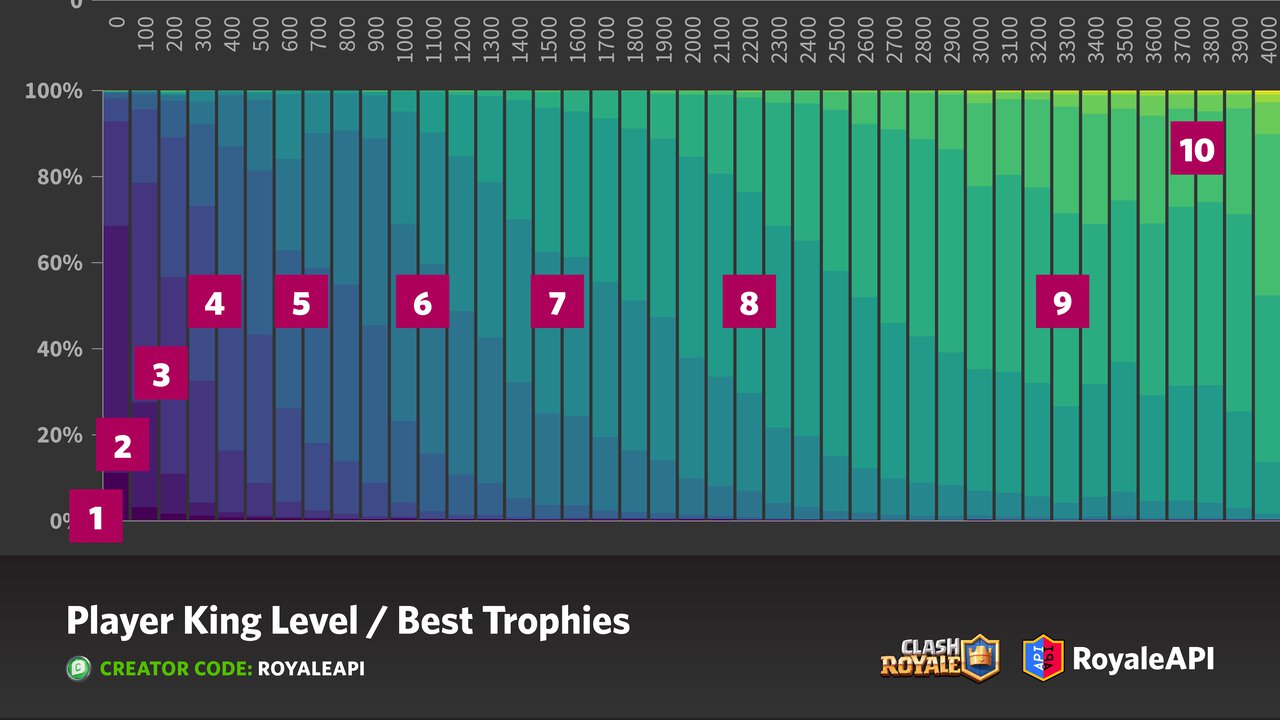
The lower end of the trophy ranges are also quite wide. We don’t have a lot of samples here. For example, the sample size for KL5 is 78k, and they range from 0 all the way up to 6000, but the majority of them are around 300-500 trophies, with the visible upper end ends at 1900 trophies.
In fact, the higher the King Level goes, the wider the trophy range is. If you play the game normally, then your King Level (account experience) will naturally go up. Trophies on the other hand is a measure of a player’s skill level (card levels also play a part). The skill range will become more and more apparent the more experience and time was invested into the game.
Methodology
Passive Data Collection
There is no native API endpoints to perform aggregations of player accounts directly from the Supercell database. The only way to assemble this data is by visiting player profiles one by one.
When you visit player profiles on our site, we save the account information to our database. We perform passive data collection because that is the most efficient way to sample data.
Active Data Collection
Active data collection with the aim to find out all the player profiles is not impossible, but it is a poor use of our resources. You can do this by looking up all possible player tags one by one using brute-force — and a user did attempt it a while ago over the span of 3 months.
As a partner of Supercell, we do enjoy elevated rate limits, but that limit is not infinite. Our request limits are used for other parts of the site also.
With this in mind, it is important to note that the player profiles represented here is not the same as the absolute active player base. Only Supercell would know what that is, and it’s not possible to do this level of analysis unless we have direct access to their raw data.
As the raw data is considered business secret, they will never be shared. We do think that our data is a good representation of the active player base. We have also intentionally limited our date range for analysis to ensure that the player accounts sampled are fetched within the last 30 days.
Player Accounts
In the last 30 days, our users have visited about 7.5 million unique player profiles on our site, and it this that data that‘s represented here.
Data for Nerds
| Level | Min | Max | Mean | Stdev |
|---|---|---|---|---|
| 1 | 0 | 6200 | 2070 | 2174 |
| 2 | 0 | 6000 | 147 | 591 |
| 3 | 0 | 6000 | 221 | 313 |
| 4 | 0 | 6200 | 470 | 448 |
| 5 | 0 | 6000 | 786 | 472 |
| 6 | 0 | 5700 | 1246 | 593 |
| 7 | 0 | 6300 | 1830 | 809 |
| 8 | 0 | 6000 | 2829 | 1020 |
| 9 | 0 | 6300 | 3871 | 871 |
| 10 | 0 | 7000 | 4686 | 567 |
| 11 | 0 | 7600 | 5201 | 378 |
| 12 | 0 | 8000 | 5521 | 313 |
| 13 | 0 | 8700 | 5816 | 330 |
| 14 | 0 | 8900 | 6173 | 409 |
Endnote
Do you find these statistical analysis useful? Would you like to see more of these in the future? What other charts would you like to see in the future? Let us know in the comments section below.
Discuss
Related Posts


 Donate to support us
Social